Monday, July 18, 2011

Short Term XAO update

Wave D up should be on the verge of heading northwards with MACD divergence on the 30min chart indicating a change (of some form) is pending. Discussed in the last post was the likelihood that this small down leg may in fact use the previous upper channel line as support – which seems to be occurring

However, a push higher should occur very shortly. Dropping under the channel line with momentum would be a cause for concern on the short term count.

Tuesday, July 12, 2011

XAO Short Term Update

The XAO is expected to bounce soon and head higher as described in the chart below. The previous wave's upper channel line may be a place for the XAO to find footing.

Dropping below the previous recent low would require re-examination of the short term wave count, although would still be legal for a flat within a triangle leg.

Wednesday, July 6, 2011

Gold - Short term update

*** 13th July UPDATE: It now appears the triangle has completed with a very small wave 'E' and the expectation is for Gold to head higher (with the obvious pull backs along the way) to 1600+. In the short term, Gold should not drop below 1540 (the ending of wave 'E'). ***


Gold's 4th Wave triangle is nearing close to completion with waves 'D' and 'E' to complete. Once finalized Gold should head upwards either in a 5 wave impulse or perhaps an ending diagonal pattern finishing above the 1600 levels.

Once a breakout of the triangle has occurred, the first pullback should provide some clues as to the future action and where Gold may end up. The final longer term action of  Gold can be seen here.

Should Gold drop below the start of wave 'C' at 1480 would cast doubt on at least the short term outlook.

Monday, July 4, 2011

Australian Interest Rates - July

The last RBA board decision left interest rates on hold (surprise surprise) and going by the text of the meeting minutes I can't understand how anyone could make a decision one way or the other based on the adjectives and nouns provided. If I were to jumble up the meeting minutes from the last several months and ask you to select the appropriate meeting minutes for the correct month - you'd have no hope.

Alternatively anyone could spend 5 mins reviewing the 90 day bill rate and making a well educated decision as to the RBAs cash rate target - as the cash rate target simply lags the 90 day bill rate. The 90 bill rate is still around 5% (4.98 as of June 30th) and is little changed since beginning of June shown here. For the upcoming July decision, there is no logic for the RBA to change the cash rate target currently at 4.75%.

XAO Short Term Update

The XAO has broken above the upper channel line after finishing a small triangle for a triple combination correction.

The overall assumption is a larger triangle is developing as described in this medium term update, this is based on the fact the last several up/down legs in the longer term sideways structure are corrective - and a triangle does make sense at this point.

A small pullback may be needed in the coming days (shown) to provide some definition to this wave 'D' upwards leg. On the downside, breaking below the down sloping support line would raise some serious questions on the validity of the count.


Wednesday, June 29, 2011

Short term XAO update

THURS UPDATE: It appears a very small triangle wave 'e' has completed after all, and the XAO has broken above the channel line. Next leg up now appears underway.

The last several trading days have not provided clear impulsive patterns higher, suggesting corrective action is ongoing and thus brings a clue - raising a strong possibility an Elliott wave triple combination corrective pattern is unfolding for this entire leg down. An ending triangle will appear at the end of triple combinations, however there tends to always be a challenge with triangles and how they play out - sometimes triangles can form one of the waves within a triangle itself. Hence, the chart below provides a rough idea how the triangle is unfolding

The down sloping channel lines now have a role to play - a solid break out and higher after the triangle completes will be a strong signal. However, there will possibly be a false break that can sometimes occur with triple combination. Supporting an end to this correction is the MACD price oscillator as it is clearly divergent on the 60min chart (not shown) since the second week of June.

The bottom line: A change in trend appears to be close at hand

Sunday, June 26, 2011

XAO Update

It appears the downwards corrective action on the XAO may still not be complete with a distinct lack of a 5 wave impulse from the lows discussed in the second part of the last XAO post.

This may mean a triple flat or a triple combination correction is unfolding.

Short Term Gold Update

Gold has seen some decent moves both up and down over the last 3 weeks. This structure labeled as triangle  wave 'C' appears to be a near completed expanding flat (3-3-5) - a corrective structure and valid within triangles and wave 2's.

Both the triangle and the green wave count (that sees a shorter term triangle completed) anticipate a push higher in the coming days. Again, the preferred count is in black with triangle waves 'D' and 'E' yet to complete.

The longer term wave structure that sees a higher Gold prices is here and anticipates levels in the 1600+ range before a significant top is in place.

Monday, June 20, 2011

Medium Term XAO update

The recent declines on the XAO have resulted in questioning of the wave count since the low of 4560 in March was broken. In addition, the down leg that started in April still looks very corrective, hence the evidence at hand implies a larger correction is most likely still unfolding. This corrective wave may in fact be a large sideways triangle.

The alternative bearish count still has validity until proven incorrect.


On the short term, Triangle Wave 'C' is below as a double flat correction. This leg should be complete or very near complete, wave 'D' should soon be underway.

Wednesday, June 15, 2011

Short Term Gold Update

Gold is still moving as described in previous posts - a triangle is most likely unfolding that will continue to see further sideways moves.

Medium Term XAO - Alternative Count consideration

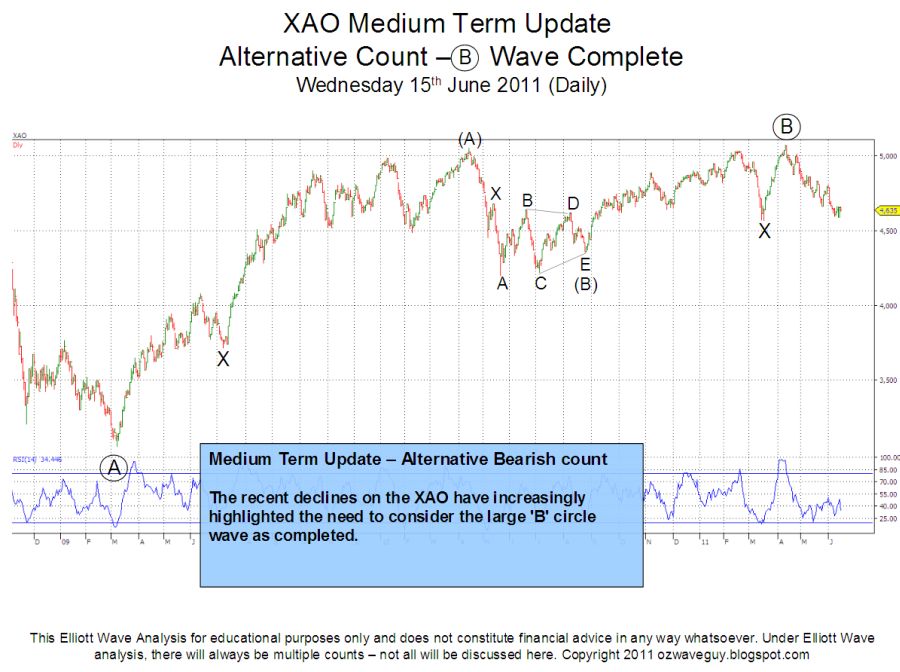
The recent declines on the XAO do seem to indicate that this down leg may be a lead in to a bigger structure, therefore it's prudent to review an alternative count should the recent low at 4584 be broken.

The chart below shows an alternative count that has the 'B' circle wave completed implying declines will now continue. There are several reasonable interpretations at this stage but the waves aren't clear enough to give a solid interpretation. The consideration is: Has the decline since the 11th April  top been in 5 waves?


The short term chart shows a decline of 5 waves. Wave (ii) a expanded flat and Wave (iv) and expanding triangle (rare). I don't like the odds of these wave structures being in the same move but it is here for consideration until clarity is seen. Under this count, a correction upwards needs to occur before the declines continue. A break out of the channel (not shown) either up or down will provide some additional clues.

Tuesday, June 7, 2011

XAO Short Term Update

The XAO continued to decline and invalidated the notion of an ending triangle for this correction discussed in the last XAO Short term post.

There is a little further clarity with the XAO, specifically two flat corrections joined by an intervening 'X' wave - Double Flat correction. The flats contain the right structure with the 'A' wave being a 3 wave move, and the 'B' wave retracing at least 61.8% of  'A'. Wave 'C' being a 5 wave move. The 'C' wave in the second flat is a little unclear, so there's still potential for a little more downside. I'm happier with this count as it seems to fit better with rules of Elliott Wave (and the Glenn Neely extensions).

There is an alternative count that is bearish and would come into play should the short term low be broken but it requires the XAO to correct upwards before an aggressive down tread commences.

The primary count is still to medium terms highs before the real fun begins.


'

Sunday, June 5, 2011

Long Term Interest Rates - Higher rates to come?

Discussed in this post was a possible ending of a long term trend in Australian interest rates. Started in 1982, a long term decline of interest rates appears to have completed as a very obvious elliott wave pattern. On the horizon are higher interest rates but after some medium term declines or sideways action that may last for many months.

This long term decline comprises of an Elliott Wave flat pattern: a 3-3-5 structure, thus a completed flat will have an A, B and a C wave with A & B having 3 waves and C with the standard 5 waves.

There is a difference between elliott waves seen in the stock market and what can be seen in interest rates and currency markets. Stock markets move up in waves of 5 and are an indication of progress where interest rates operate in waves of 3 over long periods of time. If they didn't, then conceivably interest rates would eventually reach 100% and higher.  Operating in 3 waves makes it very difficult to estimate long term trends as these 3 wave corrective patterns are the most difficult to predict due to their complexity and the range of many different types.

Therefore, it's usually easier to look for smaller 5 wave patterns within the larger corrective patterns, unless some very obvious pattern emerges - this seems to have now occurred.


Friday, June 3, 2011

XAO Short Term $30B update

The negative mood appearing in the MSM this week on the $30B loss on thursday may be an indication that a medium term bottom could almost be in place.

The index has unfolded exactly as described in the previous XAO post, however the attempted thrust up out of the Channel doesn't look like a 5 wave advance and this may imply something else is occuring. The pullback has been sharp and it's looking possible that a triangle is unfolding as a valid ending to this correction.

Further drops from here are still valid but the low at 4560 cannot be broken for this count to remain valid.

The MACD is divergent on the 60min chart below, implying weakness in the current down trend.