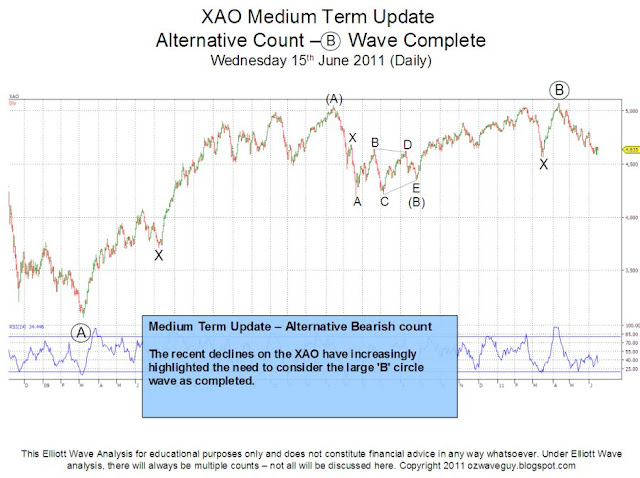
The chart below shows an alternative count that has the 'B' circle wave completed implying declines will now continue. There are several reasonable interpretations at this stage but the waves aren't clear enough to give a solid interpretation. The consideration is: Has the decline since the 11th April top been in 5 waves?
The short term chart shows a decline of 5 waves. Wave (ii) a expanded flat and Wave (iv) and expanding triangle (rare). I don't like the odds of these wave structures being in the same move but it is here for consideration until clarity is seen. Under this count, a correction upwards needs to occur before the declines continue. A break out of the channel (not shown) either up or down will provide some additional clues.


No comments:
Post a Comment